Hurricane Losses since 1900

The Rocketry Forum

Help Support The Rocketry Forum:

This site may earn a commission from merchant affiliate links, including eBay, Amazon, and others.
global data

Finally, via Ryan Maue, the figure below shows 12-month running sums of hurricanes and major hurricanes around the world. Through July, 2022 was at near-low counts of major hurricanes since 1980.

 
  • What U.S. president saw the most continental U.S. hurricane landfalls?

    • President’s Taft and Trump more than a century apart had the highest rate — 13 landfalls over their four years in office. President Obama had the lowest — 4 in 8 years. Thanks Obama!
 
  • What U.S. president saw the most continental U.S. hurricane landfalls?
    • President’s Taft and Trump more than a century apart had the highest rate — 13 landfalls over their four years in office. President Obama had the lowest — 4 in 8 years. Thanks Obama!
What are the two sets of figures? They have the same title, and different numbers.


A major hurricane is forecast to hit Florida​


ROGER PIELKE JR.
AUG 28, 2023
There's a tendency among people who have bought into a belief, people who know that that is a bad thing in scientific discussion but sometimes become convinced all the same, people like me, to be suspicious or worse of the sources of statements that run counter to the beliefs which we are comfortable calling logical, scientific conclusions. So, I looked up Roger Piekle Jr.

Reading the early paragraphs in the Wikipedia article, reading statements like "A prolific writer, his interests include understanding the politicization of science..." I am so accustomed to hearing people of a certain political bent that does not align with my own saying such things as "Those so-called scientists are all political. They just say whatever will get them grants and advance their agendas" that I was ready to believe the worst of someone who makes a career of finding or inventing evidence to support that view.

BUT

I did keep my mind open enough to read on.
Pielke has also written extensively on climate change policy. He has written that he accepts the IPCC view of the underlying science, stating, "The IPCC has concluded that greenhouse gas emissions resulting from human activity are an important driver of changes in climate. And on this basis alone I am personally convinced that it makes sense to take action to limit greenhouse gas emissions." He also states that, "Any conceivable emissions reductions policies, even if successful, cannot have a perceptible impact on the climate for many decades", and from this he concludes that, "In coming decades the only policies that can effectively be used to manage the immediate effects of climate variability and change will be adaptive."

On the issues of hurricanes and climate change he has argued that the trend in increasing damage from hurricanes is primarily due to societal and economic factors (chiefly an increase in wealth density), rather than change in the frequency and intensity.
So no, apparently not someone trying to deny human caused climate change or its deleterious effects, and I was poised to jump to a completely unsupported and erroneous conclusion about him. He seems to be someone whose reporting is at least worth taking seriously.

Now, the other hand. Everything he reported, as re-reported here, concerns trends in hurricane data up to the present, and not the projections that are based on trends in the underlying conditions that contribute to hurricanes. Good climate models should be better predictors than hurricane data alone, since they take the related trends and related physics into account. It is entirely possible, in principal, for all of the hurricane data presented, with its lack of trends, to be completely correct and for the projections of a more hurricane bedeviled future to be correct at the same time, if the general warming and specific changes in various climate parameters have not yet reached, but soon will reach a level that has a strong effect on hurricane and major hurricane frequency and intensity. "Possible in principal", I say, as I personally know essentially nothing about it.
 
For those of you that believe we can build things better and stronger to withstand the
forces of nature - this book by McPhee is one you should consider reading. He wrote
it in 1989. He nicely points out that nature always wins. You'll find his stories are eerily
similar to today's climate impacts on homes, businesses and our lives.
John_McPhee-The_Control_of_Nature.jpg


Now if you want something that brings in current social and economic impacts due
to the climate, I suggest you read this book by Bittle. It takes you down to the street
level of people, neighborhoods and regions that you may be familiar with.

TheGreatDisplacement.jpg

These are probably a better read than charts and graphs, and possibly put a
down to earth perspective on climate change.
 
What are the two sets of figures? They have the same title, and different numbers.
They’re the same table. The left one is ordered high to low by avg # of hurricanes/yrs of presidency. The right one is ordered high to low by total # of hurricanes. Unsurprisingly, FDR had the most hurricanes.
 
Interesting article.
https://research.noaa.gov/2022/06/2...annual-tropical-cyclones-in-the-20th-century/Seems like global warming may have led to a decline in the # of tropical cyclones.
Scientists think this may be due to changes in atmospheric circulation in the tropics which inhibits storm formation.
However.............
“It should be noted, however, that frequency is only one aspect controlling the risks with tropical cyclones.” He added that geographical distributions of tropical cyclones are shifting, tropical cyclones are getting more intense, rain rates are increasing and some storms are slowing down as they travel over land, all this potentially amplifying the damages to humans and coastal communities. "
(Per Savin Chand, PhD).
I read this as storm formation is a complex interplay of several different forces, not just global warming.
 
In January 2022 the European science journal called European Physical Journal Plus (part of the Springer Nature collection of journals) published a paper by Gianluca Alimonte and colleagues with the title “A critical assessment of extreme events trends in times of global warming.” The paper is essentially a review of trends in various sorts of extreme weather events since the early 20th century, including hurricanes, tornadoes, floods, droughts, and so forth. The bottom line from the article is that there are no noticeable trends in the frequency or severity of these extreme weather events during recent years. For example, the summary as to hurricanes is “To date, global observations do not show any significant trends in both the number and the energy accumulated by hurricanes.”

Here is the graph as to numbers of hurricanes and tropical storms and accumulated energy of same:
Screen+Shot+2023-08-27+at+10.52.22+PM.png

Surely no trends are visible there. And here are the key concluding sentences from the abstract:
None of these response indicators show a clear positive trend of extreme events. In conclusion on the basis of observational data, the climate crisis that, according to many sources, we are experiencing today, is not evident yet.

That last observation seems to be the one that just could not be allowed. It appears that a group of orthodoxy enforcers from academia and journalism ganged up to go to Springer Nature to demand retraction of the Alimonte, et al. paper. There followed a lengthy back and forth, which ended with the paper being retracted on August 23, 2023. A whistleblower at Springer Nature leaked the back and forth to Roger Pielke, Jr., who has published two pieces about it on his Substack, the first on July 17, and the second on August 26. You can read those two lengthy pieces for all the details.

From the Pielke July 17 piece, the pile-on began about a year ago:
[E]ight months [after publication of Alimonte, et al.], following some discussion of the paper in the Australian media, The Guardian wrote an article severely criticizing the paper. The Guardian quoted four scientists critical of the paper: Greg Holland, Lisa Alexander, Steve Sherwood, and Michael Mann.
As an example of the nature of the criticisms, Pielke quotes the execrable Michael Mann, whose comments Pielke describes as “scathing and personal.” They are also notably non-substantive, appealing to consensus without disputing the accuracy of any of the data:
[This is] another example of scientists from totally unrelated fields coming in and naively applying inappropriate methods to data they don’t understand. Either the consensus of the world’s climate experts that climate change is causing a very clear increase in many types of weather extremes is wrong, or a couple of nuclear physics dudes in Italy are wrong.

As Pielke documents, there was no allegation of scientific fraud or misconduct of any sort. This was purely a case of Mann and his henchmen demanding a retraction over a matter of disagreement with the conclusion. Alimonte, et al. stood behind their work and declined to retract. And Springer then bowed to Mann’s bullying and retracted the article on August 23.

Meanwhile, go to the (now-retracted) Alimonte, et al., paper, and look at the graphs. It is obvious that there is no trend in extreme weather events. There is no getting around this. But it is not allowed to be said in “prestigious” publications like the Springer science journals.
 
2023 Hurricane Season Update
- Roger Pielke https://rogerpielkejr.com/

“At present, there is little scientific consensus about trends in global or regional [tropical cyclone] activity, either in the past, as detected in observations or in climate model simulations, or in the future as our climate continues to change"
Kerry Emanuel, 20 Nov 2023
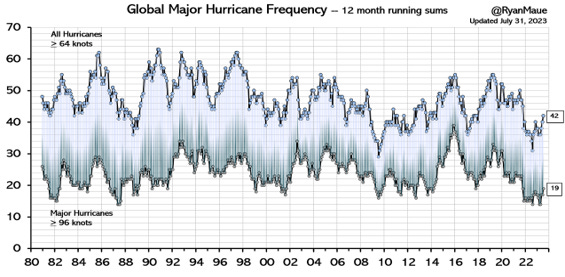
As November comes to an end, the 2023 North Atlantic hurricane season is in the books. Today I share updated figures and analyses from our peer-reviewed work on hurricanes¹ that summarize the season and place it into longer term historical context.

Mainland U.S. Hurricane and Major Hurricane Landfalls, 1900 to 2023

Source: Updated from Klotzbach et al. 2018
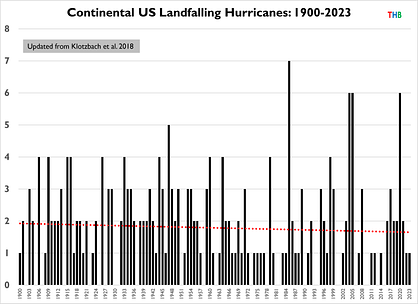
The figure above shows tropical cyclones of hurricane strength (i.e., Category 1+) that made landfall along the continental United States (CONUS) from 1900 to 2023. There was one landfall in 2023, Hurricane Idalia in Florida.

Source: Updated from Klotzbach et al. 2018
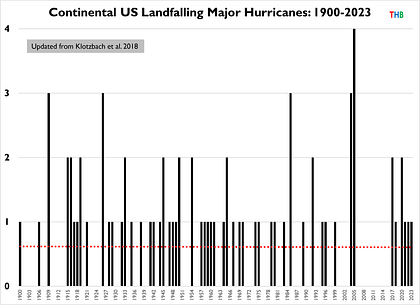
The figure above shows tropical cyclones of major hurricane strength (i.e., Category 3+) that made landfall along the continental United States, with Hurricane Idalia in 2023 making landfall as a Category 3 storm.

There are no trends in either landfalling CONUS hurricanes or major hurricanes from 1900 to 2023.

Share

Normalized CONUS Hurricane Damage 1900 to 2023

Source: Updated from Weinkle et al. 2018
Hurricane Idalia has to date resulted in about $310 million in insured loss claims in Florida, which represents a much lower figure than was originally estimated by catastrophe modelers. This equates to a total loss of less than $1 billion.²

The figure above provides an update of our normalized CONUS loss time series to 2023 values — showing an estimate of the damage in each year if hurricanes of the past made landfall with today’s level of population and development.

There is no trend in normalized losses from 1900, however, there is an upwards trend from the 1970s. Given that there has been no increase in landfalling hurricanes or major hurricanes, we would not expect to see any increase in normalized losses.³

The 1926 season has pushed over $300 billion and 2005 over $200 billion. In coming months I will update the global catastrophe loss time series, once 2023 comes to a close, but I can tell you now that weather-related insured and total economic losses of 2023 will come in lower than in recent years due to 2023’s lack of significant hurricane impacts.⁴

Share

What Role did ENSO Play in the low Losses of 2023?

One of the strongest statistical relationships observed in Atlantic hurricane behavior involves the El Niño-Southern Oscillation (ENSO). This year saw a transition to El Niño conditions in the equatorial Pacific, which historically has been associated with depressed hurricane activity, landfalls and damage.

This year saw slightly above average overall activity, just about average numbers of major hurricanes and losses far less than average or median. The figure below puts 2023 into historical context according to the state of ENSO (with 2023 indicated by the red triangle). The top panel zooms in to El Niño years (ONI >= 0.5) and the bottom panel shows all years, 1950 to 2023.

Source: Updated from Klotzbach et al. 2018. The red triangle represents 2023. Data: NOAA ONI and normalized losses as above updated from Weinkle et al. 2018. Details on this analysis can be found at this post.
The low economic losses of 2023 certainly fit the historical pattern associated with ENSO and as a new data point in the time series will reinforce that relationship. But were the low 2023 losses a result of ENSO or just good fortune?

I suspect a bit of each, with the precise amounts impossible to tease out. I note that in the 9 hurricane seasons with Aug-Sept-Oct ENSO ONI values of 1.0 or greater, total normalized losses have never exceeded $35 billion.⁵ Of course, had Hurricane Idalia taken a slightly different track, we would have the first such storm.

The data is informative and suggestive, but irreducible uncertainties and plain old ignorance are ever present as well. My guess is that the relationship that we first discovered in 1999 between ENSO and hurricane damage is not quite as strong as the statistics indicate, but that is just a hunch.
 
Can Seasonal Hurricane Activity be Forecast Accurately?

The figure below shows eleven different 2023 season hurricane forecasts complied by the Barcelona Supercomputing Center, issued in May-June of this year for seasonal activity. I have displayed all 11 forecasts that included a forecast of both major hurricanes and ACE (accumulated cyclone energy, a metric of overall activity).⁶

Sources: BSC 2023, CSU 2023
The red marker shows the 1991 to 2020 averages for both variables and the blue triangle shows 2023 values. You can see that 8 of the 11 forecasts were outperformed by the historical average, indicating that as an ensemble, these 11 forecasts we not skillful.

Overall, seasonal hurricane forecasting is a crapshoot, however the head of the class is Phil Klotzbach and his team at Colorado State University. They rigorously evaluate their forecasts, with their 2023 verification just published today, here in PDF. My evaluation of 2022 seasonal forecasts can be found here.
 
Interesting data. Blue line is major hurricane count, orange is sunspot count.

1706283711396.png
 
Back
Top