Hurricane Losses since 1900

The Rocketry Forum

Help Support The Rocketry Forum:

This site may earn a commission from merchant affiliate links, including eBay, Amazon, and others.

jderimig

Well-Known Member
TRF Sponsor
Joined
Jan 23, 2009
Messages
5,977
Reaction score
4,091
As Ian makes landfall there will be discussion on how hurricanes have become worse lately (arguable) and storm $$$ have increased greatly over time (fact). On the latter, storm losses, Pielke and others have studied could this be a result or climate change OR is it because of population increase in areas historically affected by storms?

Below is the normalized US hurricane damage by year. Below that is the formula used for normalization.
1664285801489.png

1664285827949.png
 
Pielke and others have studied could this be a result or climate change OR is it because of population increase in areas historically affected by storms?
By "Pielke" I assume you mean Robert Pielke Jr.? And not Robert Pielke his father and well known meteorologist? Here is his paper:
http://sciencepolicy.colorado.edu/admin/publication_files/resource-1688-2005.25.pdfFig. 5 is the "normalized" hurricane damage chart.
Pielke Jr. is not a climate change denier.
But he advocates for an adaptive policy of dealing with climate change rather than a reduction in emissions. That has brought him into conflict with some of his colleagues.
Excerpt:
"Governments and businesses are already heavily invested in climate policy and thus should focus resources on decisions likely to be effective with respect to policy goals. In the context of extreme events, such decisions might focus increasingly on land use, insurance, engineering, warnings and forecasts, risk assessments, and so on. These policies can make a large difference in mitigating the future impacts of climate on society"

could this be a result or climate change OR is it because of population increase in areas historically affected by storms?
Or both? And I would add a third possibility: More accurate reporting, documentation and data collection in the 120 years between 1900 and now.
 
My intitial thoughts on your post:

You're not saying where these numbers are from. The general public does not know "Pielke".
https://rogerpielkejr.substack.com/p/series-making-sense-of-trends-in
By "Pielke" I assume you mean Robert Pielke Jr.? And not Robert Pielke his father and well known meteorologist? Here is his paper:
Yes, Jr. He advocates for sensible climate policy and says we must increase the contribution to non-Co2 energy quickly. He is also against the misinformation promulgated on the green side because it damages the credibility on the issue. Particularity blaming every draught, flood or hurricane on climate change by some (especially the the media) when the climate science and the IPCC isn't there yet.
 
Or both? And I would add a third possibility: More accurate reporting, documentation and data collection in the 120 years between 1900 and now.
I will add a 4th possibility. Advances in civil engineering and construction codes compensate the increasing concentration of wealth and population in vulnerable areas.
 
One thing to factor in is the changes in building codes and zoning requirements. Buildings are much better built today, thus hold up to damage much better.
 
storm $$$ have increased greatly over time (fact).
Is that inflation adjusted dollars? I ask because every blockbuster movie every year becomes the highest grossing film in history because it's never in inflation adjusted dollars. Star Wars made $533 million in 1977, but Titantic made $1 Billion in 1997 -- 20 years later, but which movie actually made more?
 
I‘m not sure I really understand the normalization formula. What is the real wealth per-capita adjustment and the county population adjustment? What are they for and how do they affect the ‘normalized” cost for hurricanes over time?

It sounds like it’s basically trying to adjust for the increase in population and increase in personal wealth over time, so a hurricane that didn’t cause a lot of costly damage in the past, because few people lived where it hit, and they were all poor — that same hurricane today might affect a lot more people, and might destroy their more costly property, so it might cost a lot more today.

So, if that’s the case, the graph is not exactly asking this question:

On the latter, storm losses, Pielke and others have studied could this be a result or climate change OR is it because of population increase in areas historically affected by storms?

It’s assuming that’s the case and trying to “normalize” the cost of the storms based on that assumption.
 
I‘m not sure I really understand the normalization formula. What is the real wealth per-capita adjustment and the county population adjustment? What are they for and how do they affect the ‘normalized” cost for hurricanes over time?
I think it has to do with if hurricane intensity is constant every year (assume that for this explanation) but you put more people and wealth (mansions, Ferrari's and Lamborghini's) to be lost in the path, then hurricane damage costs increase.

The link to Pielke's analysis is in post #4 for a better answer than mine.
 
I think there are multiple reasons why storms cause more costly damage than they used to, and part of it is due to more people and more valuable stuff in the path of storms, but part of it is worse storms and worse conditions caused by climate change.

Two easy examples of the latter come immediately to mind.

First, the sea level has already risen a foot in some parts of the country. So a 2’ storm surge now floods areas that would have required a 3’ surge in the past. That 1’ matters for storm surge flooding.

Second, the freshwater flooding due to rainfall is getting worse. Storms are dumping more rain than they used to. That insane flooding several years ago in Texas from hurricane Harvey was due to an amount of rain that was considered physically impossible in the past. The atmosphere could not hold or transport that much water in the past. But higher ocean temperatures and atmospheric temperatures than in the past mean more water in the atmosphere than in the past and more potential catastrophic rain events than in the past. Catastrophic floods are getting worse.

Anyway, I see the point that part of the increased cost is due to more people living in vulnerable areas, and their higher wealth and valuable property being destroyed. But I think sometimes that’s used as an excuse to say the weather isn’t really getting more extreme. The fact is, it is getting more extreme, and it’s going to get worse. And maybe more and more wealthy people putting their wealth in the way of hurricanes will finally bring some attention to how costly this extreme weather turning out to be.
 
Updated hurricane data from 1900 through 2022 including Ian..

1666527355376.png


1666527396838.png
 
The cost part of a hurricane does not affect the average home owner on the coast. The federal government has done a great job of reducing or eliminating personal property damage thru Federal Flood Insurance. I live on the east coast in hurricane country. I have friends who made out like bandits with Federal payments for property damage. No one's going to pay millions for a house at the beach and not have government insurance. The hurricanes are not costing the rich anything more than time to repair their second home .
 
Here is data on the other hemisphere. Typhoon over the last 70 years.
1666889035278.png
 
The cost part of a hurricane does not affect the average home owner on the coast. The federal government has done a great job of reducing or eliminating personal property damage thru Federal Flood Insurance. I live on the east coast in hurricane country. I have friends who made out like bandits with Federal payments for property damage. No one's going to pay millions for a house at the beach and not have government insurance. The hurricanes are not costing the rich anything more than time to repair their second home .
Maybe. That still doesn't explain all the stories that we see about people, and businesses, that couldn't get/couldn't afford insurance and lost everything. I'm wondering if Federal Flood Insurance in this case is kind of like flood insurance in some areas inland, in which a) only certain locations qualify, and b) in some places, even the Federal insurance policies are prohibitively expensive. Or, maybe there is some other reason.
 
Loosely related information from NOAA/Rutgers on how this winter is progressing globally.

1670121006562.png
 
1674064805430.png

Just the Facts on Global Hurricanes

More storms? Fewer but more intense? More landfalls? No, No and No​

The figure below provides the latest update to Figure 2 of the original paper.


An update of Figure 2 of Weinkle et al. 2012, showing global landfalls of tropical cyclones of hurricane strength, for weaker (S/S Category 1 and 2) and stronger (S/S Category 3+) storms.

2022 there were 18 total landfalling tropical cyclones of at least hurricane strength around the world, of which 5 were major hurricanes. Since 1970 the median values are 16 total hurricanes, with 5 of major hurricane strength. So 2022 was very close to the median of the past half century.


Overall, based on IBTrACS best-track and preliminary data from Colorado State University since 1980, the overall number of hurricanes globally in 2022 was 86 (median = 87) and major hurricanes was 17 (median = 24). The figure below shows no long-term trends in hurricanes or major hurricanes.

1674064911323.png
If we look closely at the 12-month sums shown in the figure above we also see that the most recent 24 months has close to the least overall global activity of the past 40+ years, for both hurricanes and major hurricanes. This is not unexpected due to the ongoing triple-dip La Niña that tends to depress Pacific tropical cyclone activity while the Atlantic typically sees more frequent and intense hurricanes.

If we look at the “accumulated cyclone energy” (ACE, an integrated value of frequency and intensity) of all global tropical cyclones of at least tropical storm strength, from the CSU dataset, we see no overall trend since 1980, as you can see in the figure below.

1674064998671.png
 
First, thanks for posting sources, that makes a reasonable discussion possible. Second, an internet forum is woefully inadequate to completely hash out this topic. Here are just some quick points. There are a lot of ways to slice and dice the hurricane data, so this is a very complex subject with mountains of data and analysis.

First, the Colorado State University data. The "Observed Atlantic Named Storms - Early August Forecast" trend does show an increase. This is a comparison of their predictions, and actual observations (from: https://www.koaa.com/news/covering-...ason-plus-why-we-study-hurricanes-in-colorado)

1682122921277.png

The really remarkable thing here is that they have been able to predict the August season really quite well! This is a testament to the quality of data they're obtaining and the validity of their prediction models. Other scientific agencies using similar models (generally speaking, there are many implementations) predict that the increase in number of hurricanes will continue. (see this reference: https://www.gfdl.noaa.gov/global-warming-and-hurricanes/)

There are moderate disagreements between Vecchi and Swanson (2008), but the predictions call for somewhere inbetween modest and substantial increases in hurricane activity.

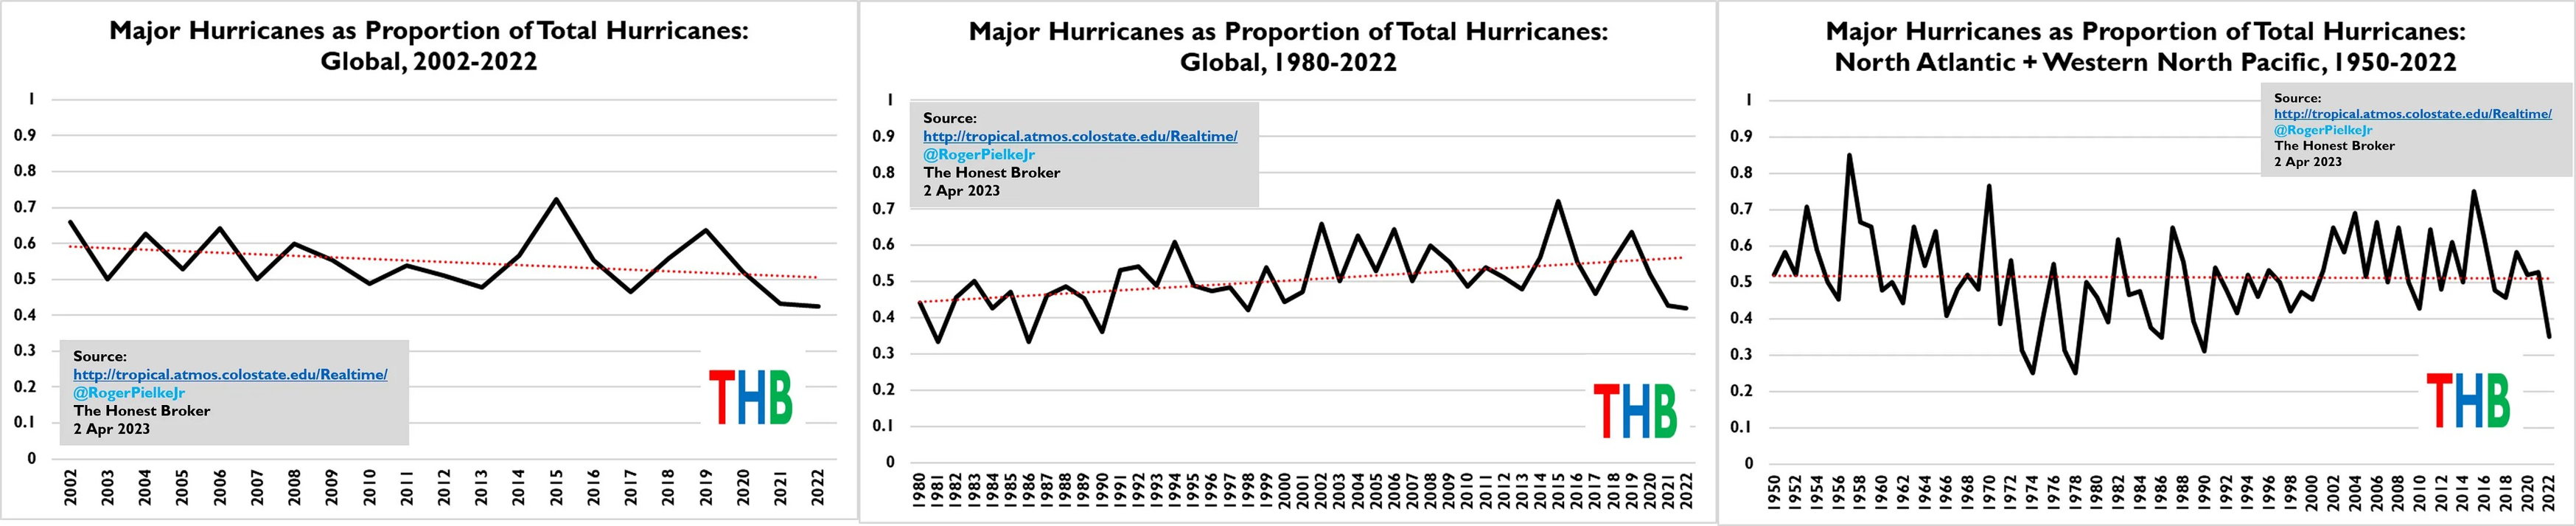
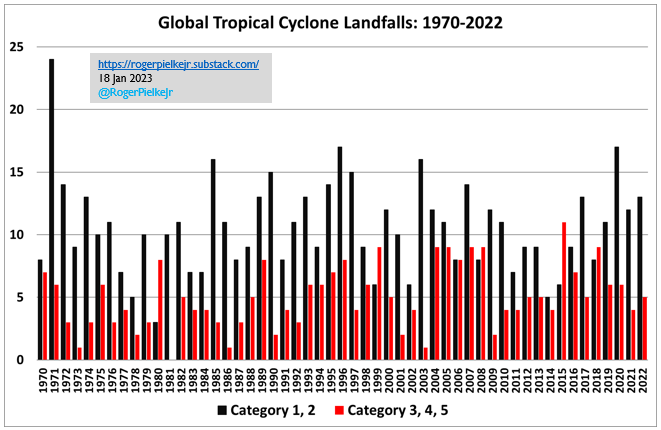
Second, most of the data you present originates from only 1 source, Ryan Maue. He is a somewhat controversial figure, and he is not inline with the majority of climate scientists. But even he is quoted as agreeing that climate change is real, and there is a human contribution, he only disagrees on the amount. His public tweets make him sound like a climate change denier, but his scientific content acknowledges that climate change is real and humans are contributing. His quote:

"Lukewarming is not climate denial," Maue said, adding, "Most of us on this side of the issue believe in lower climate sensitivity. We don't believe there's going to be 5° of warming; we figure it's at the lower end of 1.5°."

from: https://www.science.org/content/art...hief-scientist-key-us-climate-research-agency

See the noaa reference (https://www.gfdl.noaa.gov/global-warming-and-hurricanes/) for a more nuanced analysis that includes more scientific perspectives that just one.

Again, there are literally mountains of data, and presenting charts from primarily only one single scientist (Maue) is misleading. One voice doesn't establish a consensus. The atmospheric models are sufficiently good to accurately predict seasonal hurricanes, and those same (or similar) models predict that the trend will continue.
 
Atlantic Hurricane Paleotempestology

A new pre-print by Elizabeth Wallace and colleagues takes much longer look at North Atlantic hurricane activity, building off of storm proxies — an area of study with the delightful name, paleotempestology (coined by Kerry Emanuel if memory serves). You can see their estimates of historical hurricane activity below, indicating large variability and many centuries with much greater activity than in our lifetimes. Interesting research!

https://scholar.google.com/citations?hl=en&user=X_Op6aQAAAAJ&view_op=list_works&sortby=pubdate
1690991158336.png


1690991206425.png
 
Last edited:
Is that inflation adjusted dollars? I ask because every blockbuster movie every year becomes the highest grossing film in history because it's never in inflation adjusted dollars. Star Wars made $533 million in 1977, but Titantic made $1 Billion in 1997 -- 20 years later, but which movie actually made more?
Movie revenues are not adjusted for inflation and population growth. Need to adjust by showing per capita tickets sold. I bet nothing comes close to the heyday of movies at the time of Gone With the Wind.
It sounds like Ian might end up being one of the taller spikes on the graph.
Had a time share on Sanibel. Resort destroyed, beach gone :(
Storm surge completely over washed the island.
There will be a huge one time bump in maintenance fees. Glad I sold out 3 months before Ian:)
 
Good news (so far). Hail LSR which largest source of weather and climate disaster losses are running well below the mean for the last 20 years.

1691094543249.png
 
Movie revenues are not adjusted for inflation and population growth. Need to adjust by showing per capita tickets sold. I bet nothing comes close to the heyday of movies at the time of Gone With the Wind.
Tangent: I've seen movie revenue data inflation adjusted. Even without population growth figured, just the inflation adjusted gross, Gone with the Wind is the all time winner.

OK, tangent complete.
 
Interesting. I have no response except that Virginia (I assume that's Virginia like the others) is not the whole world. Come to think of it, why Virginia? It looks like that might be cherry picking a location that has the data someone wants. Or maybe it's just a Virginia-based organization.

That upward boom in crop yield corresponds about as well to the radical industrialization of farming as it does to CO2 concentration. The image seems to be suggesting that increased CO2 is good for the crop yield, but industrialization seems to me to be the most likely cause of the increased yield. It's certain that industrialization of farming is a direct contributor to both increasing crop yield and increasing CO2 concentration, so teasing them apart would be difficult.

And why jus the corn yield. This is, once again, a yellow flag for potential cherry picking. (Why not cherry yield? 😁)

A couple of the lower models, especially the grey and olive ones, have done a pretty good job of staying near the actuals. What do those two say for the next 10 or 25 years; the time axis seems to end about five years out from today. Also, every model's prediction is rising for those five years, including the best matches so far.
1691763635629.png
 
.

A major hurricane is forecast to hit Florida​


ROGER PIELKE JR.
AUG 28, 2023


1693241356820.png

“We conclude that the historical Atlantic hurricane data at this stage do not provide compelling evidence for a substantial greenhouse warming-induced century-scale increase in: frequency of tropical storms, hurricanes, or major hurricanes, or in the proportion of hurricanes that become major hurricanes” NOAA

Tropical storm Idalia is projected to make landfall in Florida in a few days. That means hurricane hype will no doubt be dialed up to 11. For those who’d like to be able to place that hype into the context of evidence and research, this post offer some quick points and pointers.

  • I encourage everyone, especially journalists, to start with NOAA’s Global Warming and Hurricanes overview. It is updated (May 2023) and led by Tom Knutson, whose work along with colleagues provided much of the basis for the conclusions of the recent IPCC AR6 WG1 on tropical cyclones and hurricanes.
  • Here is what NOAA concludes:
    • “We conclude that the historical Atlantic hurricane data at this stage do not provide compelling evidence for a substantial greenhouse warming-induced century-scale increase in: frequency of tropical storms, hurricanes, or major hurricanes, or in the proportion of hurricanes that become major hurricanes.”
    • Let me know if you see that statement quoted in any reporting this week.
  • What about IPCC?
    • “[T]here is still no consensus on the relative magnitude of human and natural influences on past changes in Atlantic hurricane activity, and particularly on which factor has dominated the observed increase (Ting et al., 2015) and it remains uncertain whether past changes in Atlantic TC activity are outside the range of natural variability.”
  • You will likely hear a common refrain — something like There are not more hurricanes, but the ones that do form are likely to be major hurricanes due to climate change. Here is a cherry-picker’s guide to supporting or countering this slogan:
    • The panels below show the proportion of major hurricanes to 2022 starting in 2002 (left), 1980 (middle) and 1950 (right).

    • You can see that by varying the starting date you can get a downward, upward or no trend. This helps to explain why NOAA reached its conclusion that I quoted above. Data, methods and discussion here.
  • You will also likely hear claims that hurricanes now result in greater precipitation. Here is what NOAA says about that:
    • “an anthropogenic influence has not been formally detected specifically for hurricane-related precipitation”
    • Again, tell me if you see that quoted anywhere.
 
Last edited:
1. Does the GFDL/NOAA article say that any increase in hurricane frequency and intensity is not due to increased greenhouse gasses, or does it say that we cannot conclude YET with HIGH CONFIDENCE that it is due to increased greenhouse gasses, and that more research needs to be done?
2. Is the statement applicable globally or only to the Atlantic Basin?
3. Are there multiple factors that may influence the formation of tropical storms and hurricanes, besides global warming, such as amount of aerosols in the atmosphere, the slowing of the AMOC, etc.?
4. From the NOAA/GFDL article:
"The results in Fig. 14 indicate that the greatest agreement across modeling studies is for an increase in rain rates and intensity, whereas frequency change (whether for all tropical cyclones or for category 4-5 tropical cyclones) does not show as much agreement across studies. The global proportion of tropical cyclones that reach very intense (category 4 and 5) levels is projected to increase (medium to high confidence) due to anthropogenic warming, according to the assessment (not shown)."

1693245892753.png
Figure 14. Summary of regional and global TC projections assuming a 2°C global anthropogenic warming scenario. Each inset panel shows the median and percentile ranges for projected percentage changes in TC frequency, category 4–5 TC frequency, TC intensity, and TC near-storm rain rate derived from published studies. For TC frequency, the 5th–95th-percentile range across the studies is shown. For category 4–5 TC frequency, TC intensity, and TC near-storm rain rates the 10th–90th-percentile range is shown. Note the different vertical-axis scales used for the two halves of each panel. Source: Knutson, T. et al., 2020: Tropical Cyclones and Climate Change Assessment. Part II: Projected Response to Anthropogenic Warming. Bull. Amer. Meteorol. Soc., https://doi.org/10.1175/BAMS-D-18-0194.1
 
Back
Top