You are using an out of date browser. It may not display this or other websites correctly.
You should upgrade or use an alternative browser.
You should upgrade or use an alternative browser.
CD - anyone use altimeter data to "measure" CD?
- Thread starter ClayD
- Start date


Help Support The Rocketry Forum:
This site may earn a commission from merchant affiliate
links, including eBay, Amazon, and others.


cjl
Well-Known Member
- Joined
- Jan 18, 2009
- Messages
- 12,567
- Reaction score
- 45
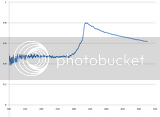
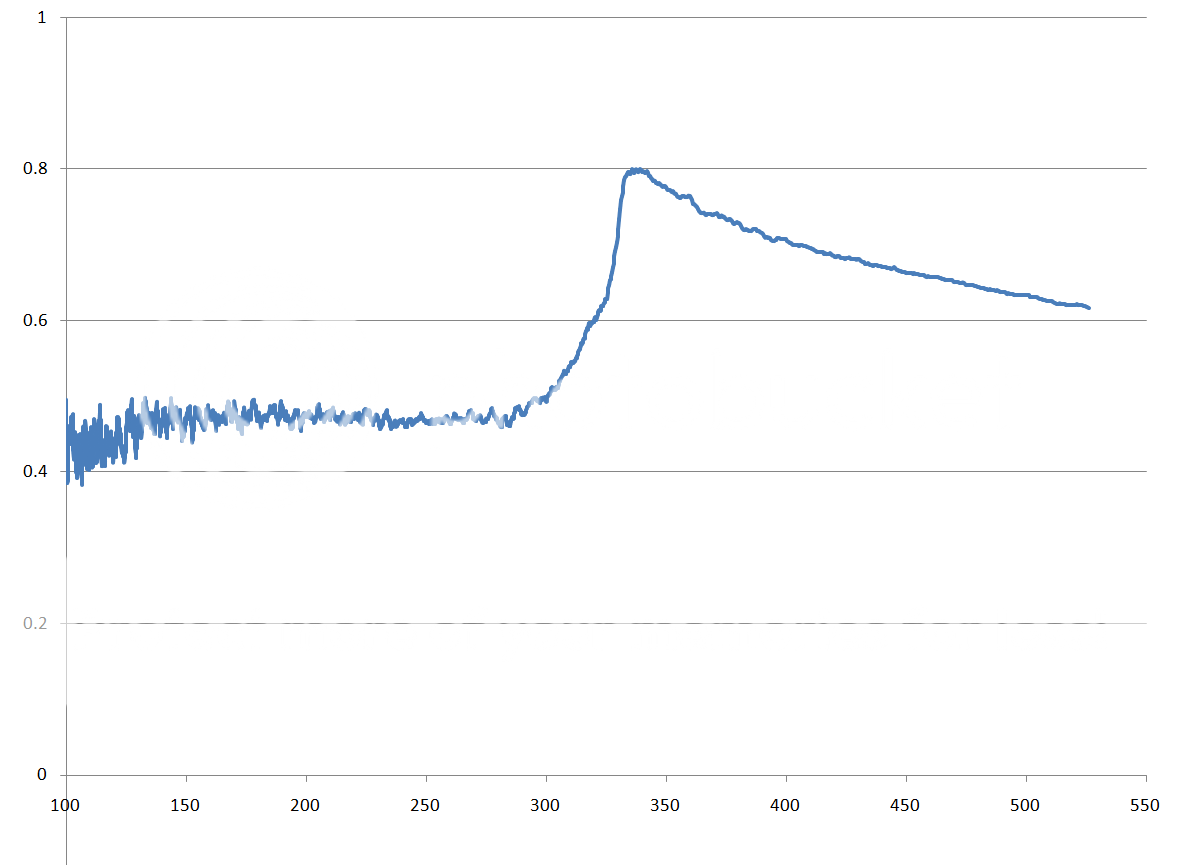
Basically, you just have to draw a line of best fit through those. That middle image indicates that your accuracy is limited by your accelerometer resolution. It looks like you have a low-speed Cd around 0.9 or so, at mach 0.4 or so, your Cd is 0.6, and at mach 0.6, it's around 0.55. I've done some of that kind of measurement before - here's an example. This was measured with a prototype Parrot altimeter a couple years ago, and it's for a basically stock PML Cirrus Dart (velocities are in m/s, so mach 1 is around 340 or so):
Higher resolution accelerometers are definitely beneficial though - as you can see, with the Parrot, the scatter is much less than with most altimeters. The resolution also improves as speed increases (as you can see with both my data and your data).
Higher resolution accelerometers are definitely beneficial though - as you can see, with the Parrot, the scatter is much less than with most altimeters. The resolution also improves as speed increases (as you can see with both my data and your data).
Last edited:
ClayD
Well-Known Member
- Joined
- Dec 10, 2010
- Messages
- 2,440
- Reaction score
- 8
Thanks Chris, I like your readout.. its almost what the RASaero looks like.
I think mine is jumpy not due to the accelerometer, but the data record rate.(analog resistance change doesnt really have a resolution) I deffinately wish it was higher. that is at 200 samples per second, i think it is limited by the adc, but i dont know the microcontroller speed either. I think the current featherweight stuff is at 400 samples a second?
whats odd, was that i think the second image, is actualy a better way to find a mean average than a plot of the mean average...
this would give the low and high coefficient for the velocity.. being and under thrust vs. coast coefficients.
What makes me wonder, and post, is it goes from a higher CD to a lower one.. as in yours goes up from low to high(as it should)
do you think the launch rod could have thrown it off?
cjl
Well-Known Member
- Joined
- Jan 18, 2009
- Messages
- 12,567
- Reaction score
- 45
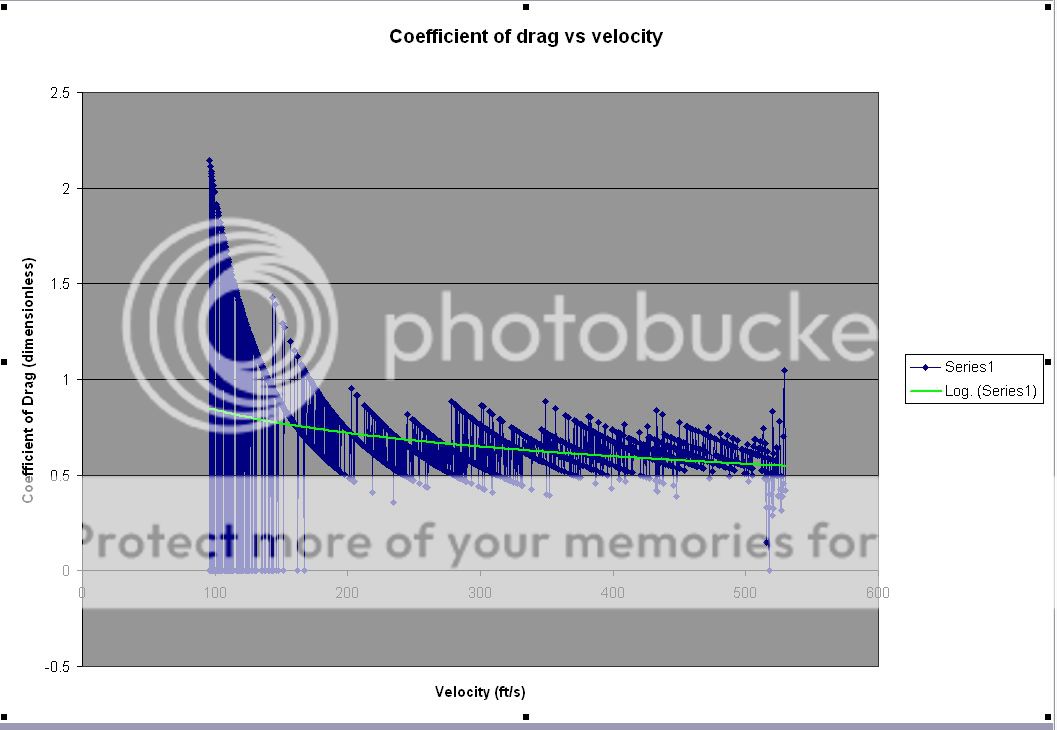
Nah - that stairstepped pattern is definitely due to accelerometer resolution. Here's an example that I've measured with my R-DAS on a much slower rocket:
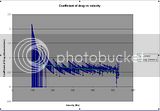
Each of the curving lines represents a line of constant acceleration, and the jump from one to the next is the same as the minimum resolvable change in the rocket's accelerometer. As a result, the accuracy of your CD measurement is much, much better at high speeds, and similarly, a high resolution accel will improve it substantially.
Also, the decreasing trend in both yours and the one I have in this post is expected. Typically, Cd will decrease as speed increases up to around mach 0.6 or 0.7, and then it will start to increase above that. You usually won't see the Cd increase until around mach 0.7 or higher, sometimes even as high as mach 0.9 or 0.95.
bobkrech
Well-Known Member
- Joined
- Jan 20, 2009
- Messages
- 8,352
- Reaction score
- 55
Actually the data looks like it has an aliasing problem due to a sample rate slower than the bandpass of the sensor/amplifier.
The bandpass of the sensor should be limited to 1/2 of the sampling rate (Nyquist sampling theory) by a low pass filter so the high frequency oscillations are filtered out. In most altimeter it is not.
You can take the data and pass it thought a digital low pass filter, or take a FFT of the data, perform a digital low pass filtering by getting rid of the high frequency data above the Nyquist frequency, and then do an inverse FFT to generate the original data minus the high frequency components.
You will have a much smoother curve to run through your Cd calculation program.
Bob
ClayD
Well-Known Member
- Joined
- Dec 10, 2010
- Messages
- 2,440
- Reaction score
- 8
Actually the data looks like it has an aliasing problem due to a sample rate slower than the bandpass of the sensor/amplifier.
The bandpass of the sensor should be limited to 1/2 of the sampling rate (Nyquist sampling theory) by a low pass filter so the high frequency oscillations are filtered out. In most altimeter it is not.
You can take the data and pass it thought a digital low pass filter, or take a FFT of the data, perform a digital low pass filtering by getting rid of the high frequency data above the Nyquist frequency, and then do an inverse FFT to generate the original data minus the high frequency components.
You will have a much smoother curve to run through your Cd calculation program.
Bob
So the nyqist is saying if my output amplifier votage is at a frequency of 400mhz, i need to be sampling at 800mhz and passing it through a low pass filter to get back to the 400mhz, thus removing or narrowing the effects of error. I am guessing this just removes spikes for errors? narrowing the margin of error, while maintaining the original "events".
I assume the raw data on my altimeter (prior to interpretation) is what needs resampled. This would be the ADC code, in my case is a 3 digit - 804, 803, 802 series of numbers that coresponded to the output voltage.
I mainly want to understand this, so I can fly a rocket with a documented record of CD's which would make my motor characterization that much more accurate. Both will always have a margin of error, and am comfortable with that.
I can generally hit AT 38mm motors within 5 to 10 NS of what is published through the current motor characterization. But other motors, or bigger motors, and that starts to drastically fall off...(probably due to more vibration)
I want to find a way to see if the motors I'm making are going to be "different" in performance than they are in flight. The more accurate the CD i can get, the better chance of an accurate motor characterization...
cjl
Well-Known Member
- Joined
- Jan 18, 2009
- Messages
- 12,567
- Reaction score
- 45
Actually the data looks like it has an aliasing problem due to a sample rate slower than the bandpass of the sensor/amplifier.
Nope.
Interesting theory, but it's definitely accelerometer resolution. The problem is that many accelerometers can only measure increments of 0.1G (or, perhaps slightly more accurately, the ADC can only distinguish changes of 0.1G in the output signal of the accelerometer). Slower rockets will only ever have a deceleration due to drag of 0.5G or so. As a result, there's really only about 5 or 6 discrete steps that can be measured. The reason that each step is a curve is because the conversion from measured deceleration to Cd is as follows:
1) Convert deceleration to drag force using the known mass of the rocket
2) Determine dynamic pressure from current velocity and altitude
3) Cd = drag force/(dynamic pressure times frontal area).
Since dynamic pressure scales with velocity squared, a line of constant deceleration will look like a 1/v^2 plot, which is exactly what is observed.
Now, the faster your rocket goes, the more accurate the Cd measurement is. At higher speed, the rocket has substantially higher drag, and this substantially higher drag-induced deceleration. Because of this, the relative accuracy of the altimeter's accelerometer goes up.
(I've done the analysis manually a number of times)
bobkrech
Well-Known Member
- Joined
- Jan 20, 2009
- Messages
- 8,352
- Reaction score
- 55
CJL
I agree that it is influenced by the resolution limit, however every accelerometer data I have seen has has several bits of noise on it. Neither the Parrot nor the RDAS sample the accelerometer above the accelerometer response frequency so the high frequency noise contribute to the noise in the measurement. If you had a 50-100 Hz LP filter on the input to the digitizer the noise level would be lower than what you typically obtain. You can obtain higher synthetic resolution by performing a n-point average of the data before you calculate the Cd and you will get a smoother curve.
Bob
cjl
Well-Known Member
- Joined
- Jan 18, 2009
- Messages
- 12,567
- Reaction score
- 45
CJL
I agree that it is influenced by the resolution limit, however every accelerometer data I have seen has has several bits of noise on it. Neither the Parrot nor the RDAS sample the accelerometer above the accelerometer response frequency so the high frequency noise contribute to the noise in the measurement. If you had a 50-100 Hz LP filter on the input to the digitizer the noise level would be lower than what you typically obtain. You can obtain higher synthetic resolution by performing a n-point average of the data before you calculate the Cd and you will get a smoother curve.
Bob
That may be true for my Parrot data (which does show substantial noise at the lower velocities, and the noise does not appear to be resolution based). For the data in the OP and from my Rdas though, you can clearly see the lines of constant acceleration, which cause an enormous data spread compared to pretty much anything else.
I may have to try some frequency analysis for some of my Parrot and Raven data though - it could prove useful. This may give me the excuse I've needed to write a MATLAB-based Raven data analysis program.
Last edited:
The problem is that many accelerometers can only measure increments of 0.1G (or, perhaps slightly more accurately, the ADC can only distinguish changes of 0.1G in the output signal of the accelerometer). Slower rockets will only ever have a deceleration due to drag of 0.5G or so. As a result, there's really only about 5 or 6 discrete steps that can be measured. The reason that each step is a curve is because the conversion from measured deceleration to Cd is as follows:
1) Convert deceleration to drag force using the known mass of the rocket
2) Determine dynamic pressure from current velocity and altitude
3) Cd = drag force/(dynamic pressure times frontal area).
Since dynamic pressure scales with velocity squared, a line of constant deceleration will look like a 1/v^2 plot, which is exactly what is observed.
Now, the faster your rocket goes, the more accurate the Cd measurement is. At higher speed, the rocket has substantially higher drag, and this substantially higher drag-induced deceleration. Because of this, the relative accuracy of the altimeter's accelerometer goes up.
(I've done the analysis manually a number of times)
Bingo. Those curves you see are constant-acceleration curves, and if there are a couple of bits of noise, that's where you see a few of curves on top of each other for the same velocity.
CJL
You can obtain higher synthetic resolution by performing a n-point average of the data before you calculate the Cd and you will get a smoother curve.
Bob
Also true. What I did in the Parrot analysis template (which we still haven't implemented in the Featherweight Interface Program, unfortunately) was a low-pass filter that used a moving average with the number of points selected according to the velocity. At high speed, you didn't average as many points, which worked because you had plenty of acceleration resolution, but it was changing quickly. At low speed, you could average more points together because the value you were trying to measure wasn't changing very fast, and you needed to average more points to reduce noise on that low-amplitude signal. I used that method to get these plots:
Rocket with Von Karman nosecone
Rockets with conical and ogive-ish nosecones:
- Joined
- Jan 23, 2009
- Messages
- 5,989
- Reaction score
- 4,097
CJL
I agree that it is influenced by the resolution limit, however every accelerometer data I have seen has has several bits of noise on it. Neither the Parrot nor the RDAS sample the accelerometer above the accelerometer response frequency so the high frequency noise contribute to the noise in the measurement. If you had a 50-100 Hz LP filter on the input to the digitizer the noise level would be lower than what you typically obtain. You can obtain higher synthetic resolution by performing a n-point average of the data before you calculate the Cd and you will get a smoother curve.
Bob
Excellent point and you can't anti-alias in software or firmware, it's too late. I was surprised to learn early on that many altimeters do not have anti-aliasing filters between the analog sensors and the a/d. Shame-shame.
- Joined
- Mar 20, 2009
- Messages
- 2,460
- Reaction score
- 1,971
I think I have more experience with data acquisition than Joe average guy, but less an typical practitioner and much less than a designer, so please take my questions with a grain of salt. . .
I think in the context of this conversation, resolution would be limited by the ADC, not the accelerometer, correct? I assume the accelerometer is a device that would be the chip level equivalent of a mass on a beam with a strain gage, therefore it would be 'analog.'
My recollection of the Nyquist frequency was that it was the frequency required to fit data that was not subject to periodic fluctuations from the data source (I think my wording is poor FYI). As an example, if the data was a sine wave at 100Hz, you had to sample at roughly 2.6 times the frequency (i.e. 260Hz) or you could be subject to a bad fit. If you sampled at 50 Hz, you could be getting the same point on each side of that 100Hz sine wave, so it would look like a straight line, even though the real data was sinusoidal. I didn't cheat and look up something on Wikipedia (or text books which are at work) so if I butchered the explanation, I'm sorry. Since our rockets accelerate and the negatively accelerate, is the Nyquist criteria important, as the data acquisition is faster then the periodic variation of the data?
The one thing I am relatively sure of is that noise is just a pain. If you want data that is valid for 1e-4 units, your sensor better not be bouncing around at a 1e-2 unit level. Is the biggest issue with valid data acquisition and analysis based on ADC resolution (i.e. the ability to equate one bit of data to a value), sampling frequency (Nyquist) or system noise? It seems that a filter on the data input would only correct the noise issue, but I could be completely misunderstanding the issue.
Any comments are appreciated. They don't have to be altimeter specific, just generalizations.
Thanks!
Sandy.
ClayD
Well-Known Member
- Joined
- Dec 10, 2010
- Messages
- 2,440
- Reaction score
- 8
So what i am getting from this thread.... is that the digitized data, is going to have a higher error rate during initial thrust phase, but then during the "fall off" thrust phase and coast, where the change is somewhat more gradual as far as the accelerometer is concerned, it has a different error rate. (albeit CJL says ill still have more noise than he does..:smile") (or noise rate)
(or noise rate)
so, what i am gussing is an option for me, is that i can take my digitized data, and "normalize it" by removing the large spikes first(fairly simple.) then averaging to get a "smoother" value for acceloration. even if i have to average the average.. Then i could re-run the data through the cd calculations, motor characterizing, and have a smoother readout.
I am sure this will increase the error of the altitude and achieved velocity, also causing an issue with the cd and motor charachteristic. But, Even if its not anti-Aliased- by a theory that proves it maintains accuracy, it would be normalized, and based on - several flights, i can average the averages and get pretty darn close..
sounds like a lot of dang work.... my luck i would get all that data, then cato my rocket....
(or noise rate)so, what i am gussing is an option for me, is that i can take my digitized data, and "normalize it" by removing the large spikes first(fairly simple.) then averaging to get a "smoother" value for acceloration. even if i have to average the average.. Then i could re-run the data through the cd calculations, motor characterizing, and have a smoother readout.
I am sure this will increase the error of the altitude and achieved velocity, also causing an issue with the cd and motor charachteristic. But, Even if its not anti-Aliased- by a theory that proves it maintains accuracy, it would be normalized, and based on - several flights, i can average the averages and get pretty darn close..
sounds like a lot of dang work....
my luck i would get all that data, then cato my rocket....- Joined
- Jan 23, 2009
- Messages
- 5,989
- Reaction score
- 4,097
Since our rockets accelerate and the negatively accelerate, is the Nyquist criteria important, as the data acquisition is faster then the periodic variation of the data?
Sandy.
It's not primarily a data fit issue its an aliasing issue. The picture below (classical from Nyquist explanations) shows what can happen.

So yes, if the noise or real high frequency component of the acceleration signal is small then the aliasing error will probably not materially affect altimeter function.
However there have been some real famous cases with hybrid motors which can have very high amplitude high frequency components in the thrust which have wreaked all sorts of havoc with accelerometer based altimeters ranging from failure to detect launch to random apogee deployments when the altimeter design failed to adhere to Nyquist criteria in the adc signal path.
ClayD
Well-Known Member
- Joined
- Dec 10, 2010
- Messages
- 2,440
- Reaction score
- 8
I think in the context of this conversation, resolution would be limited by the ADC, not the accelerometer, correct? I assume the accelerometer is a device that would be the chip level equivalent of a mass on a beam with a strain gage, therefore it would be 'analog.'
Sandy.
its more like a Pot. if you ask me.. it varies capacitance(or resistance i cant remember which one) based on surface area, and is a beam...
this part of it is very analog.. and not limited to resolution... however what can be limited is the amount of force applied vs amplification of the change..
IE. you can have a 4g accellerometer that has supper resolution*as cjl*terms it. but if theres too much change, it *bottoms out*and doesnt work for a 40g flight
this 4g accelerometer across 4g's may have a 3 volt swing...
whereas, a 130g accellerometer only has that same 3 volt swing...
both being based on common adc voltage "input range"
meaning for every .1volt of change, theres a lot more force represented.
so although its an analog out put... its resolution is really the "power exponent of change"
so to look at resolution you look at the g'rating, the voltage range of the sensor and adc, and the digitizing of that voltage range by the adc the more numbers the higher the digital resolution you were refering to..
So a good way to put it is that there is analog and digital resolution...
Thanks for your post... btw.. wikipedia is not cheeting, its accepting being lied to- wikipedia needs to fall off the earth.. ... look at rocket motors, NFPA is a government agency...
Similar threads
- Replies
- 8
- Views
- 1K
- Replies
- 7
- Views
- 1K