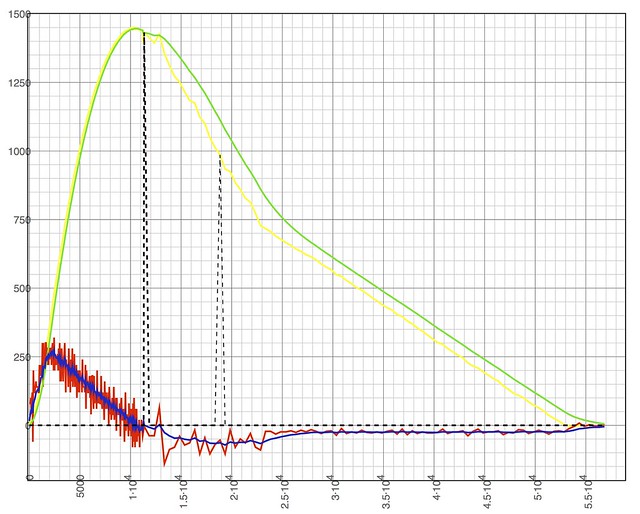
Yellow is raw altitude, green is filtered altitude. Red is raw velocity, blue is filtered velocity. Dotted lines are charges going off. Time is in milliseconds. Apparently when I make a post at 3 a.m., I leave a lot of info out!
Cl(VII), I've used that method for a long time, and I use it on my smaller stuff, but recently had a recovery failure on a L2 attempt that made me shy away from it. I'm sure I did something wrong, but I still went to something else.
You should replot your data using a spreadsheet and fix up the axis units so it makes it easier to view.
If the axis output is in milliseconds, make another column and divide by 1000 to convert to seconds and format the column to xxxxx.xx (2 digits after the decimal point), and use the new column for the x-axis with time in seconds. Suggested: min = 0 seconds, max = 60 seconds, major grid unit = 10 seconds, minor axis grid = 1 second.
For the primary y-axis which is altitude suggest min = 0', max = 1500', major grid unit = 250', minor grid unit = 25'
Take the velcocity(ies) and have them use a secondary y-axis so you can expand the velocity scale to a useful range. Suggested values: min = -200 fps, max = 400 fps, major grid unit = 100 fps, minor grid unit = 10 fps. (This makes both major and minor grid line match up for both the primary and secondary y-axis.)
I'm assuming that you are averaging the y-axis points in your own spreadsheet as there is a time delay in all numbers due to the averaging. This is made worse by the options in the Eggtimer. Your up sample rate is probably 20 hz but your down sample rate is 2 hz. The down sample rate is too slow to analyze the parachute opening time. It looks like your post apogee descent rate is ~62.5 fps with a ~31' delta t and your post main descent rate is ~24 fps with a 12' delta t.
The minimum deployment time is recovery gear length in feet divided by the velocity in fps. If your gear length is 30 feet and your velocity is 60 fps your minimum deployment time is 0.5 seconds. When you are sampling at a 31' resolution rate, you can not determine the deployment time. If you increased the sampling rate to 20 Hz, the distance resolution is then reduced to 3' and you can make a good estimate of the deployment time.
The averaging routine added a 2 second phase delay to your data. When you average velocity (or altitude), you should do a symmetrical average about the sampling point to avoid any time offset.
If you have a real data file, not a plot, post it and I'll give it back in a spreadsheet.
Bob


") maybe velocity?
maybe velocity?